Unisoxx Marketing Analysis
Overview
Created as my final project for the WBS Marketing Analytics Course, this was an intense three week project where I completed a MarTech evaluation and assessment of Q1 and Q2 2021 for a ecommerce sock shop called Unisoxx.
It's a fictional brand I created as a UX & UI design project in which I designed and user-tested the site. I used this opportunity to build the website using HTML, CSS and JavaScript.
To Live WebsiteHard Skills
Soft Skills
Concept
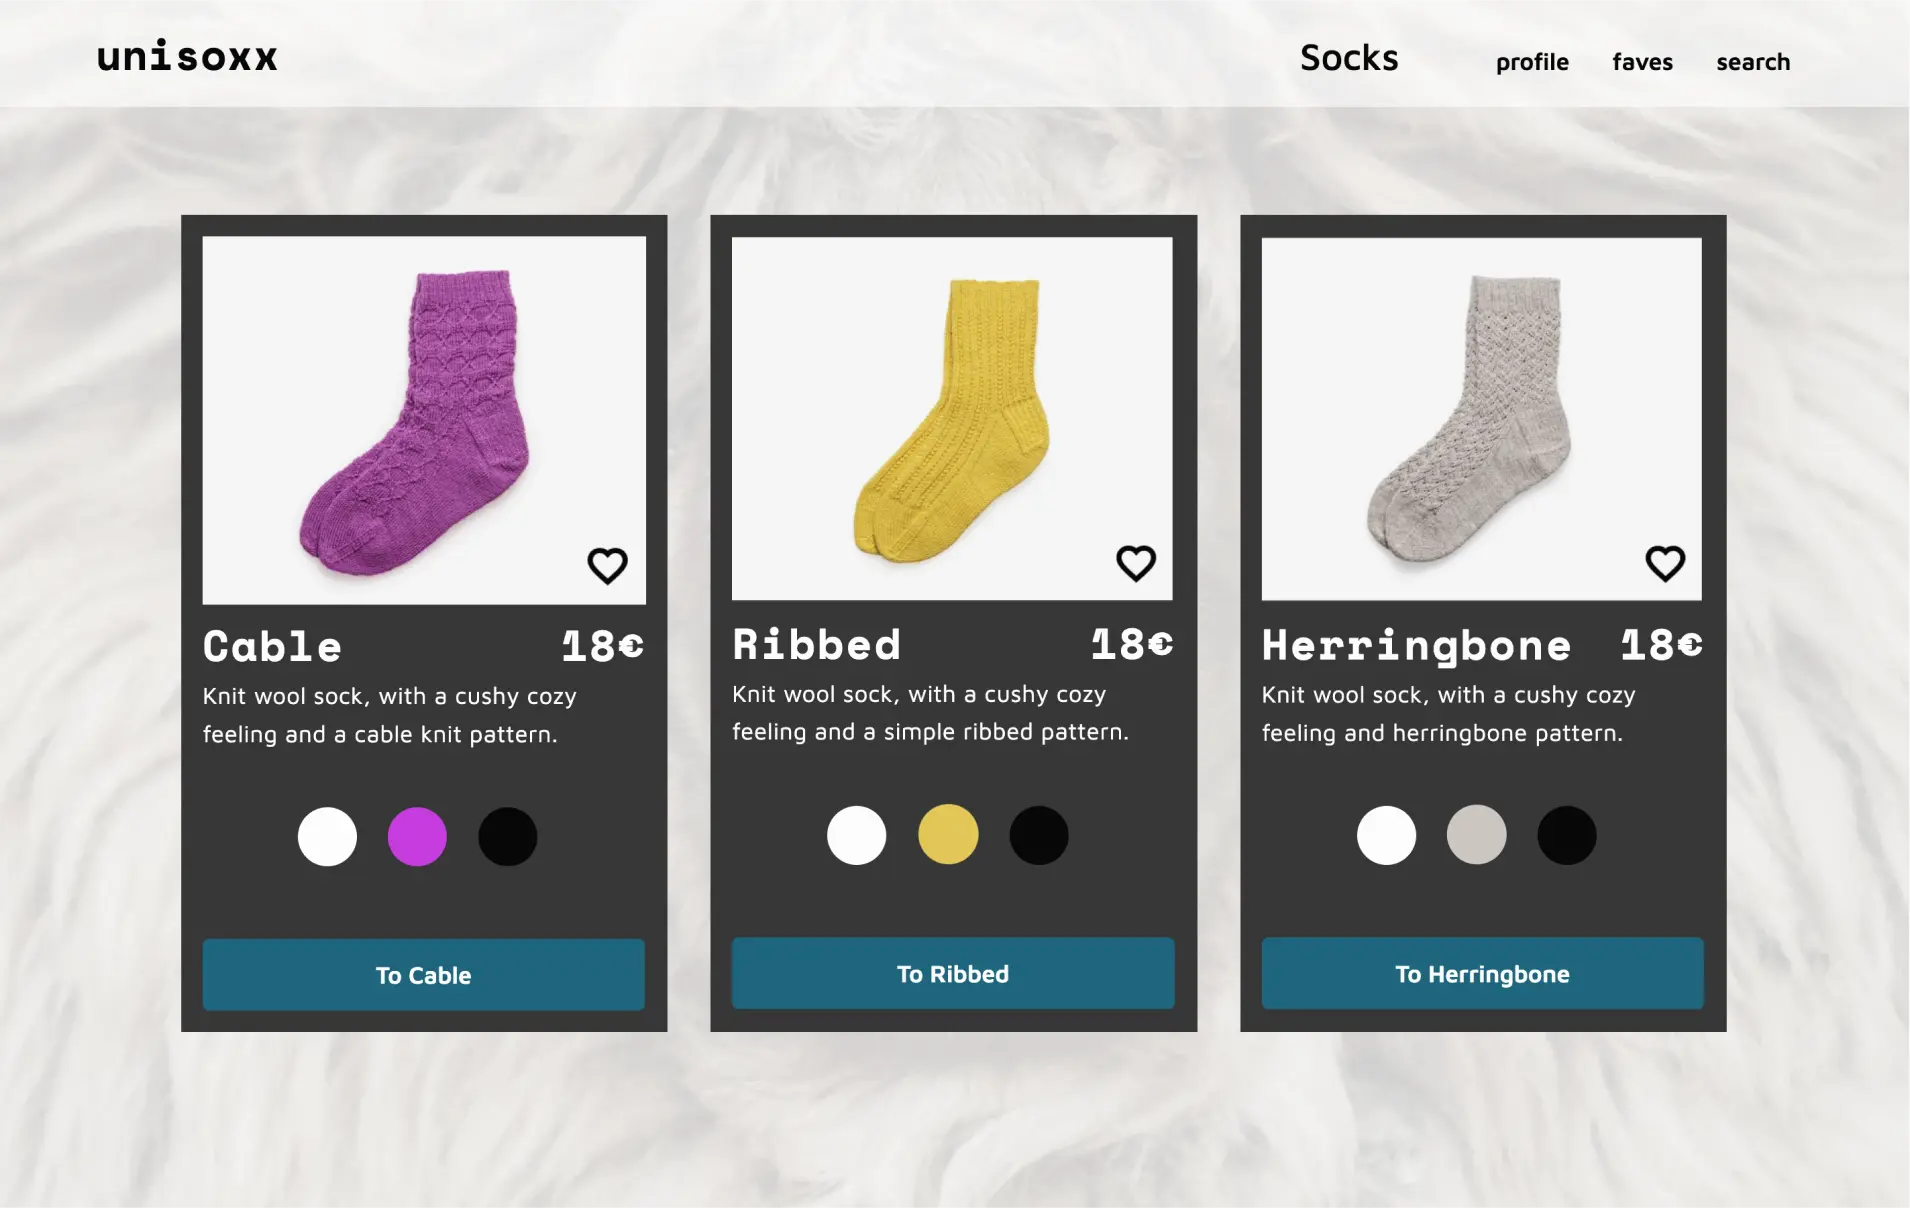
Unisoxx was started on a simple concept: selling high quality socks that aren't gendered. The business went online with the first sales in 2021. The company is doing well, but there is one person on the marketing team who handles all marketing needs.
Challenge
I was hired as a Marketing Analyst to:
- help organize and maintain the MarTech stack
- analyze marketing data
- assist in assessing the state of the business in preparation for future funding
My Questions
To structure my approach to this project, I asked the following questions:
- What updates are needed to the MarTech stack?
- What tracking tags are needed?
- Is the brand appealing to the intended market?
- How is the company performing in sales?
- How are the luxury products performing?
- How is the website performing?
My answers to these questions are the basis of my final presentation.
MarTech Stack Update
Using Google Sheets I built a table to compare and contrast MarTech tools using weighted scoring.
Tool Provider Decision Matrix


I used Google Sheets again, to build a tracking measurement plan for tag implementation. I then implemented the tags to the live site using Google Tag Manager.
Tracking Measurement Plan
Data Exploration & Presentation
With data from four tables - Inventory, Customer Information, Billing & Campaign Analytics - I dove into the data using BigQuery.
I took all my insights and compiled them into a stakeholder presentation.
Stakeholder Presentation


Additionally, I made my Looker Studio version complete with two interactive dashboards available for personal exploration.
To Looker StudioKey Learnings
Happily, in addition to the learnings below, my project was chosen for Demo Day where I presented along with all the other graduating classes.
- I have the ability and knowledge to work as a full stack Marketing Analyst.
- My bookkeeping skills acquired from decades of balancing registers makes joining tables in SQL easy.
- Although my sales experience is in brick and mortar stores, my instincts serve me well in ecommerce. One of my earliest queries was to find the number of return customers. Every retail business wants to see customers come back.
- If a weird technical glitch happens during a presentation, I now know that it's an opportunity to show off my calm & cool debugging skills.